From GraphQL to CSV: the story of API accessibility

GraphQL is a hot topic at the moment and it even started appearing in jobs listing. CSV is a totally different story, it hit it’s peak of popularity before the majority of us was even born 😀.
Something old, something new,
GraphQL was designed to make life easier for the front-end developers and Facebook engineers have done such a great job that it became more enjoyable than querying SQL directly (especially since you don’t have to do joins anymore). But the result of GraphQL query is always JSON which is fine if you build a website or mobile app but is not so suitable for importing into 3-rd party tools. CSV, on the other hand is de facto standard for analysts, data scientist and everyone who work with spreadsheets.
Being programmers, Roman Hotsiy and I (from APIs.guru) didn’t experience any of those problems up until we decided to take part in Neo4J hackathon:
We found it very helpful and inspiring to bring the people and activities of the GraphQL Community into one database with a GraphQL-API endpoint.
It contains tweets, GitHub repositories, Stackoverflow questions and answers, Meetup events and the users and tags related to them.
Write a (mobile) demo, application, dashboard, visualization, timeline, react component, whatever you want against this backend.
We found out about the hackathon on Friday at lunch time and on Saturday noon we had to start our journey to GraphQL Europe. So we were on really tied schedule to build something we could publicly release. We brainstormed a few crazy ideas involving Image Recognition and Machine Learning but fell back to the dashboard idea suggested by organizers.
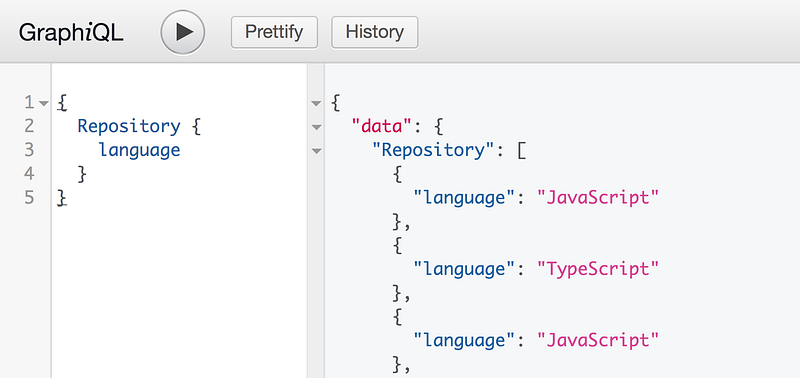
The first step was to write some queries that provide data for interesting insights in GraphQL community. For example, with all the efforts Facebook put into reference implementation it’s no surprise that JS is quite popular in the community but what about other languages. Bellow is a query that gets the primary language of GitHub repositories mentioning “GraphQL” keyword:
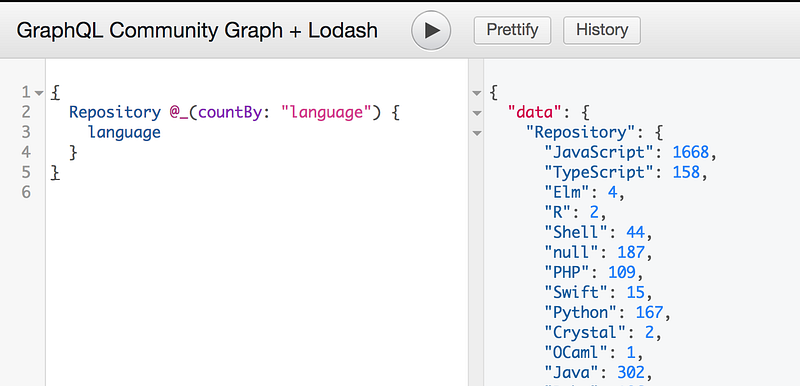
Next logical step would be to count a number of repositories per language. Would it be great to do it directly inside the query? Something like COUNT function in SQL. Few month ago we had this idea and as result, GraphQL Lodash was born. It allows to use many filtering, aggregation, etc., functions from the popular Lodash library. Let’s add “countBy” to the query:
Looks great! And you can test it yourself:
But how to visualize this data? Here we are out of our comfort zone. We specialize on tooling around APIs and don’t have much experience with visualization libraries like D3. So we decided to do it hackathon style and use Google Spreadsheets as a dashboard. We wanted our graphs to update based on the latest data since it can’t be called “dashboard” otherwise :) So we needed to figure out a way how to query data from within a spreadsheet.
GraphQL queries are usually sent as HTTP POST, however, the majority of servers also support HTTP GET with query specified inside URL. So if you click on this link you will see the resulting JSON.
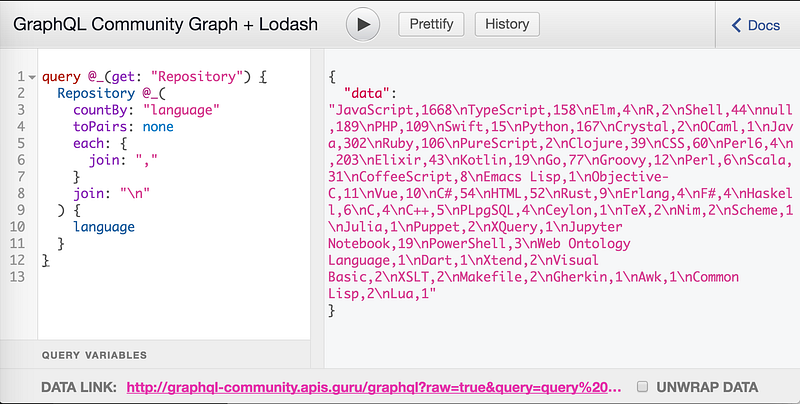
The title of this article suggests that Google Spreadsheet doesn’t allow importing data from JSON and only supports XML, HTML, and CSV. And what can be simpler that CSV? You just stringify values and join them with commas. We used a little bit of Lodash dark magic and got this:
The result looks strange, it’s actually JSON object with a single data property that contains CSV as a value. This is a standard wrapper for all GraphQL responses and the last barrier for us. So we decided to use brute force and set up a proxy that would remove it. On the screenshot above you can see “Unwrap Data” checkbox which adds &unwrap=true to “Data Link” URL. After all those manipulations we received url that points to CSV directly! 🎉
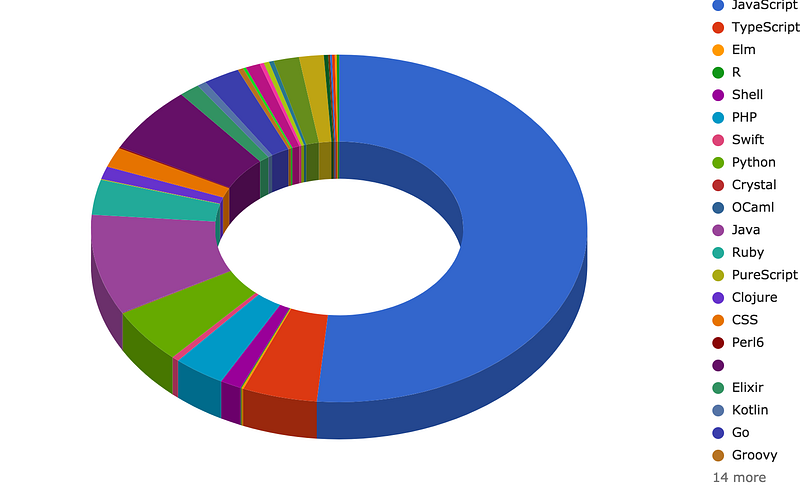
Rest of the project was really straightforward: we used IMPORTDATA function to import CSV into a spreadsheet and a few additional clicks got us a nice chart:
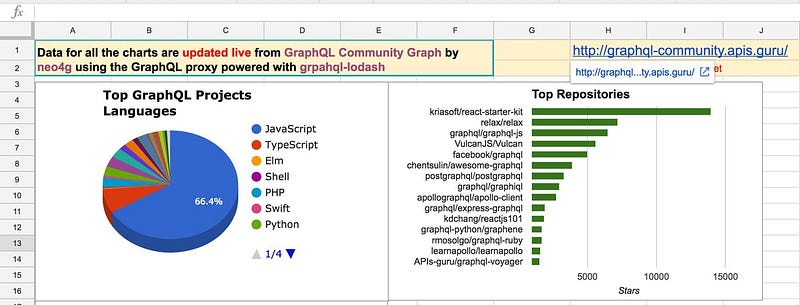
Repeating this process with a few more queries and our hackathon submission was done:
It was really great to hear @lyonwj from Neo4j giving a shout about our project from the stage of GraphQL Europe. Moreover, as the prize, we got nice T-shirts and two pairs of AirPods.
Takeaway
A real lesson I got from this hackathon is:
“API accessibility” is important
For something as simple as making report writing code is overkill. And having URL to CSV file is what allows anyone dig into the data without any coding. Our hackathon project is just a proof of concept we built in less than a day. To provide a real solution we have to figure out how to replace Lodash dark magic with something more intuitive.
We need your feedback. Is GraphQL to CSV proxy something that can help you with everyday tasks?